Page History
...
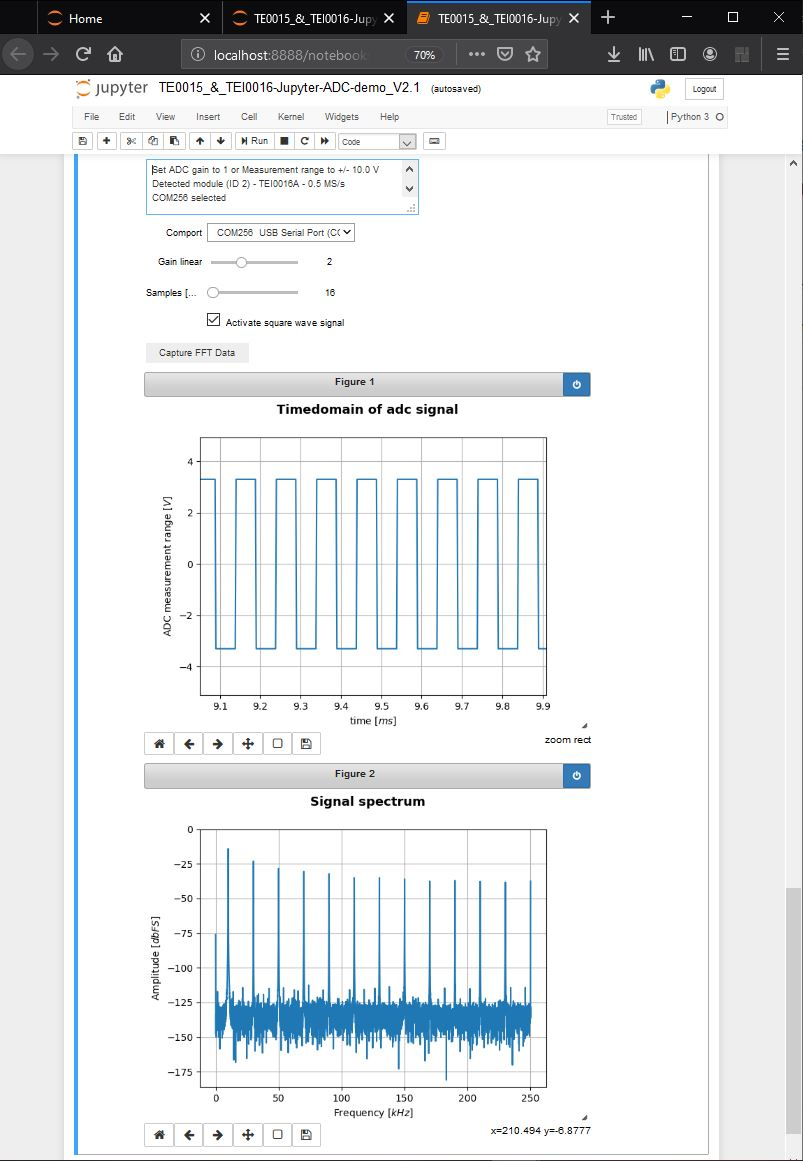
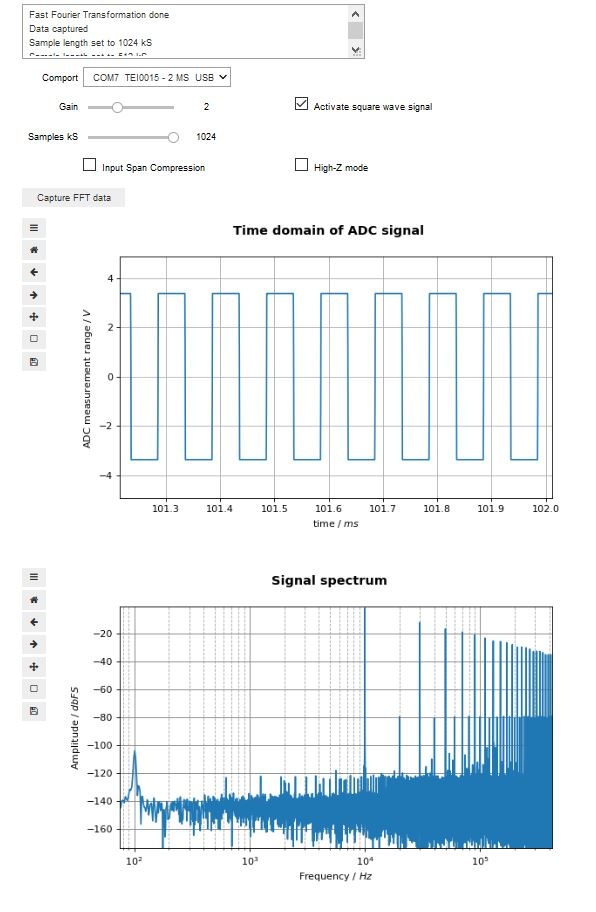
This demo provides an example on how to use the communication interface provided in the modules firmware to setup the pre-amplification and trigger an ADC measurement. This measurement is converted to show it's value over time, and it's Fast Fourier Transformation / frequency spectrum.
The download of the demo download contains the demo in a separate folder, a folder with setup notebooks Setup Notebooks, the FPGA Design file and a the related wiki pages in pdf format. The demo consist of two files, one is the notebook Notebook which contains the GUI and the other is a code module, containing the functional analytical part of the demo. These files must be in the same folder when running the demo. The modules ADC is controlled via the Intel Max 10 FPGA. In shipment condition, the FPGA is programmed with the necessary FPGA Design to run this demo.
The wiki page "Installation guide for Jupyter", available via the superior page, describes how to run Jupyter and open a Notebook.
| Scroll Title | ||||
|---|---|---|---|---|
| ||||
|

GUI features
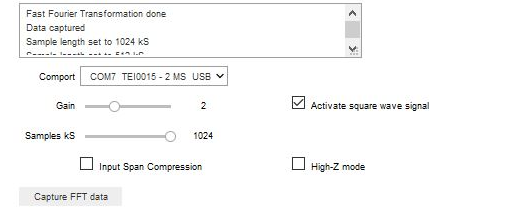
Drop-down List "Comport" :
- COM-port list for selecting a COM-port.
Listed are the port, the modules name and its USB ID
During notebook initialization, ports are scanned
...
Button "Capture FFT data" :
Re-applies the appointed GUI values and features to the module and triggers a signal measurement followed by the data converting conversion and plotting
Using the demo
...
Overview
Content Tools