Page History
This demo provides an example on how to use the communication interface provided in the modules firmware,
to setup the pre-amplification and trigger an ADC measurement. This measurement is converted to show
its value over time, and Fourier transformed, showing its frequency spectrum.
The download of the demo contains the demo in a separate folder and the FPGA Design file.
The demo consist of two files, one is the notebook which contains the GUI and the other is a code module,
containing the functional part of the demo. These files must be in the same folder when running the demo.
The modules adc is controlled via the Intel Max 10 FPGA. In shipment condition, the FPGA is programmed with
the necessary FPGA Design to run this demo.
Using the demo
This demo is designed with the focus of capturing signals. Therefore the module works like a storage
oscilloscope. After a trigger event, the module saves module saves after a trigger event 1 million samples of ADC measurement in its SDRAM.Those values are gathered in parts of 16 kbytes and converted from RAW ADC data to standard integers and
floating point numbers.
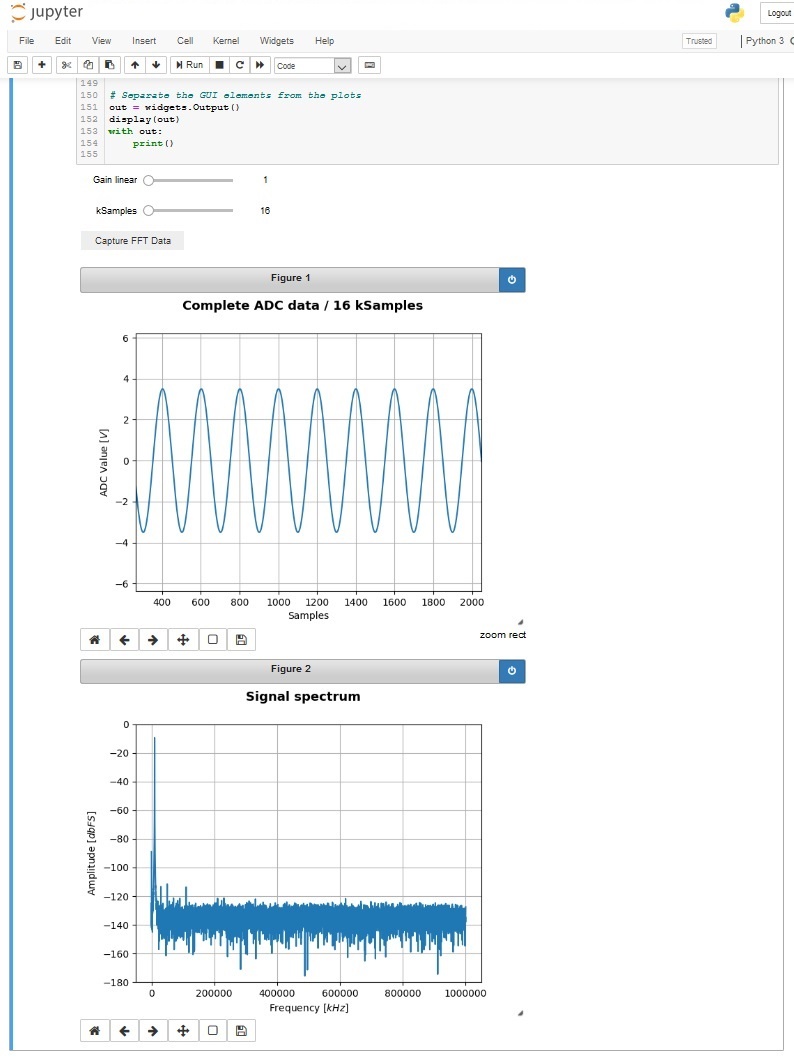
The signal is plotted, showing its value over time, and Fourier transformed, showing its frequency spectrum.
The demo scans for existing comports in its initialisation phase. So the module needs to be connected
to the computer prior to running the demo.
When this demo runs, it displays a graphical user interface, setup the comport and the module first.
After this, the demo and the module can communicate.
Now supply a signal to the inputs (via SMA jack or connector J8).
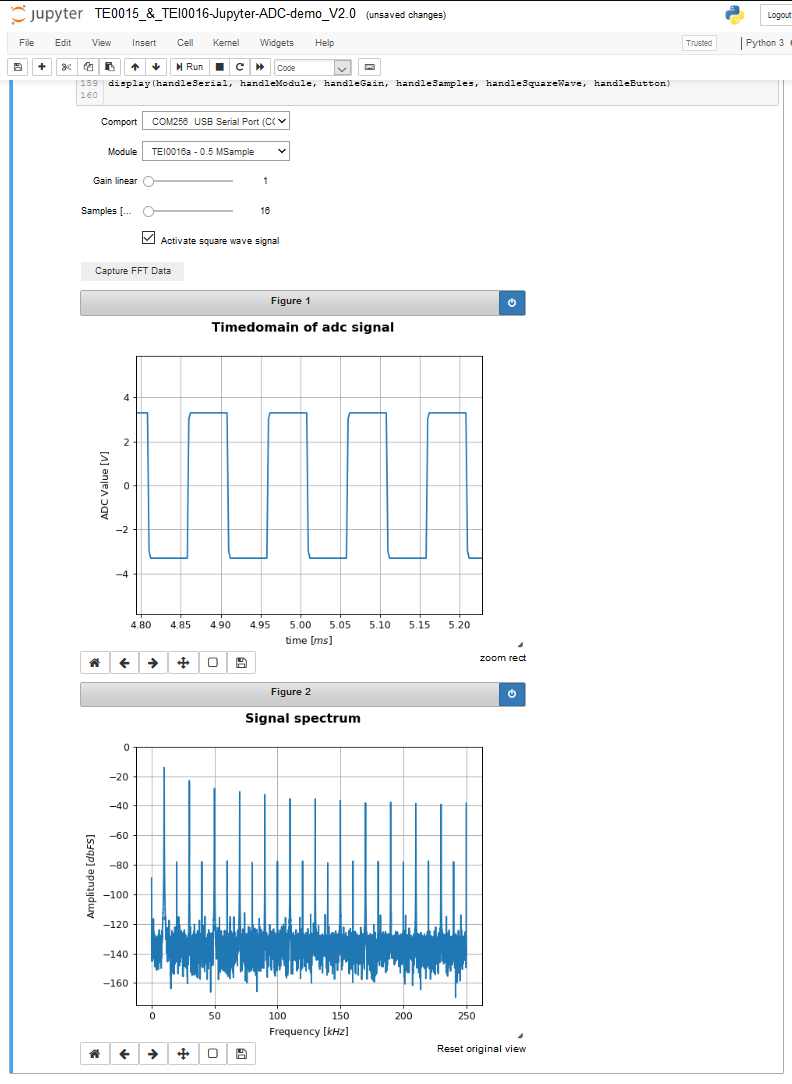
An other option is to use the modules square wave signal output. Connect the digital outputs D5 and D6 to
the input trough a resistor of at least 1 kilo Ohm and activate the signal through the checkbox.
Be careful, do not shorten the outputs D5 or D6 to ground.
One can set up a pre amplification gain of the input signal and the amount of samples to be processed.
By pressing the button, the input signal will be plotted and shownThe user can easily access the pre-amplification and the length of the processed and plotted part of the data
through a GUI.
Communicating with module:
...
Module TEI0015 - AD4003BCPZ-RL7
Resolution: 18-bit / in 5 nibbles
Maximum sampling rate: 2 MSPS
...
Module TEI0016 - ADAQ7988 / ADAQ7980
Resolution: 16-bit / in 4 nibbles
Maximum sampling rate: 0.5 MSps / 1 MSps
...
Overview
Content Tools